How 2025 Is Breaking Away From 2024
By: David Sicherman
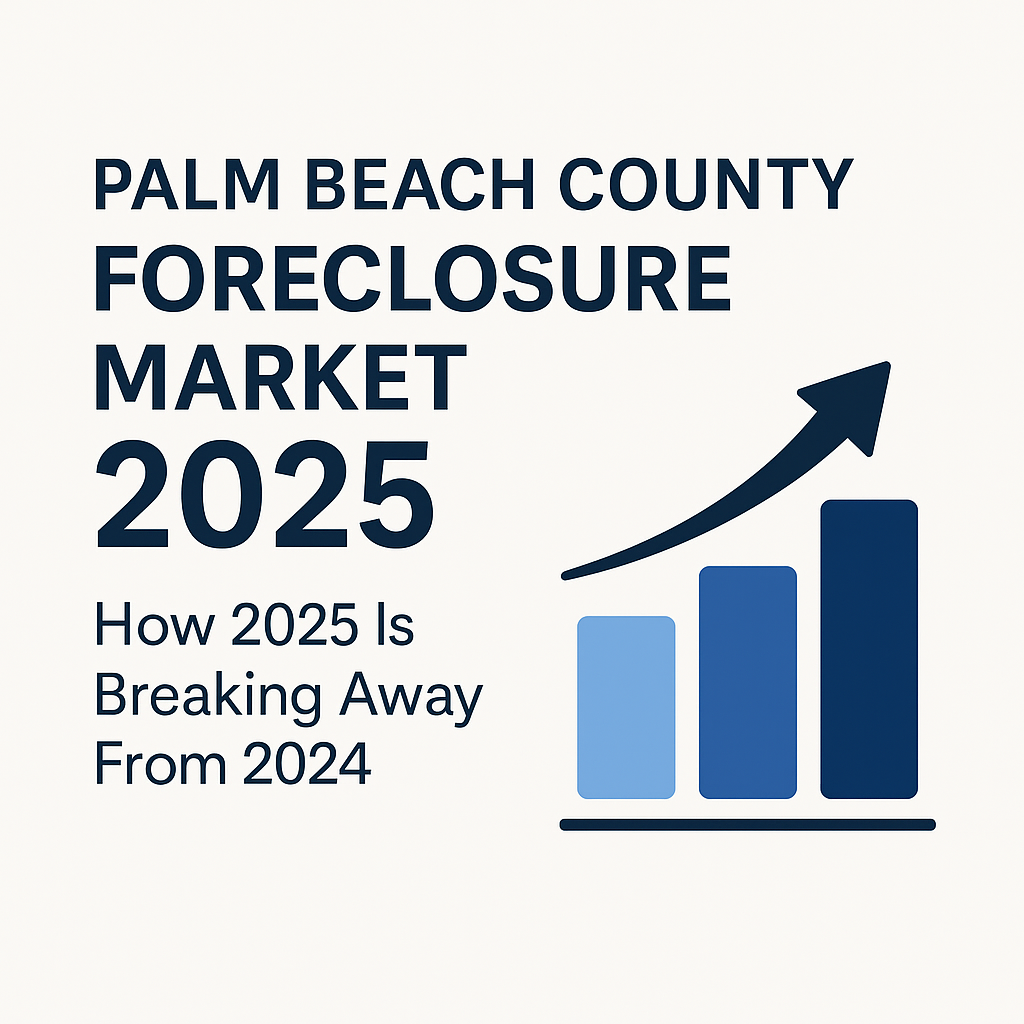
Palm Beach County Foreclosure Market Report: How 2025 Is Breaking Away From 2024 Foreclosures
Palm Beach County’s foreclosure landscape shifted dramatically in 2025, marking a clear departure from the softer, more stagnant auction activity of 2024. While cancellations continued to dominate both years, the scale and pace of scheduled auctions, investor participation, and completed sales changed meaningfully in 2025.
Using 2024 as a baseline, the 2025 numbers show a market with higher volume, stronger investor demand, and a foreclosure pipeline finally moving after years of delays and backlog.
1. Total Auction Volume: 2025 Surges Ahead
The most striking contrast between the two years is the sharp rise in overall auction volume.
2024 Overview
2024 posted subdued results, with most months declining year-over-year. Notable characteristics include:
Frequent double-digit drops (e.g., May 2024 down 22.12%, August down 21.77%, November down 26.53%).
Monthly totals mostly ranging 115–183, with only January reaching above 220.
A foreclosure environment that suggested ongoing loan workouts, lender postponements, and slower case movement.
2025 Takes Off
In contrast, nearly every month of 2025 outpaced its prior-year counterpart:
January 2025 up 7.08% vs. January 2024
June up 64.03%
July up 75.91% - one of the largest jumps in the dataset
August up 32.17%
October up 6.38%
Monthly totals frequently hit the 200+ range, representing a meaningful expansion of foreclosure activity. This surge indicates a pipeline that accelerated significantly, likely reflecting maturing delinquencies, cases exiting litigation, or lenders pushing through delayed inventory.
2. Cancellations Remain High, But Volume Grows in 2025
Both years share one critical characteristic: the majority of scheduled auctions never reach the sale phase.
2024 Cancellation Behavior
Cancellations often reached 75–85% of scheduled auctions—for example:
127 cancellations out of 155 auctions in March 2024
141 cancellations out of 176 auctions in May 2024
This pattern reflected a market where workout activity, reinstatements, and lender strategy kept many properties from reaching auction.
2025: Higher Volume, Same High Cancellation Rate
Even as total auctions increased dramatically in 2025, cancellations stayed proportional:
169 cancellations out of 228 auctions in June 2025
180 cancellations out of 241 auctions in July 2025
161 cancellations out of 200 auctions in October 2025
The consistency suggests that borrowers’ last-minute resolutions and lender postponements remain standard practice, regardless of rising foreclosure volume.
3. Completed Sales Rise: Stronger Investor Activity in 2025
While cancellations still overshadow actual sales, the completed auction activity in 2025 tells a very different story than 2024.
Third-Party Investor Purchases (TPI): The clearest differentiator
2024:
Investor purchases generally ranged 15–32 per month, indicating modest demand and limited equity-positive deals.
2025:
Investor activity increased notably, with many months posting 20+ third-party sales, including:
24 in January
28 in June
33 in July (the single highest month across both years)
25 in August
This demonstrates that more properties coming to auction in 2025 had viable equity spreads, and buyer confidence was significantly higher than in the previous year.
Plaintiff Wins (REO Additions) Also Increase
In 2024, plaintiff sales were typically low (9–19 per month).
In 2025, both June and July saw over 28 plaintiff wins, reflecting:
More properties reaching the auction stage
A larger share of homes with insufficient bidding activity
An expanding pipeline in general
This means banks were taking back more properties, even as investor purchases rose.
4. A Notable Outlier: December 2025 Market Slowdown
December 2025 stands out dramatically:
Only 28 total auctions (vs. 118 in December 2024)
A steep year-over-year decline of 76.27%
Very low sale results (just 5 total completed sales)
This likely represents a mix of seasonal slowdown and fewer cases reaching completion at year-end, rather than a true reversal of 2025’s overall trend.
5. What the 2025 Foreclosure Market Tells Us
The comparison between 2024 and 2025 paints a clear picture:
? Foreclosure activity accelerated significantly in 2025
Higher filing-to-sale flow and clearing of backlog pushed more cases to auction.
? Investor demand strengthened
More third-party buyers stepped in, especially midyear, reflecting confidence in property values and profitability.
? Lenders moved more aggressively
Higher scheduled auctions and an increase in plaintiff wins indicate more decisive action by lenders compared to 2024.
? Despite the surge, cancellations remained dominant
Even with higher volume, roughly three out of four scheduled auctions still never made it to sale.
Conclusion: 2025 Was a Turning Point for Palm Beach County’s Distressed Market
While 2024 reflected a sluggish, workout-heavy foreclosure environment, 2025 marked a clear shift toward increased throughput, heightened investor competition, and a more active distressed market overall.
If these patterns persist, Palm Beach County could enter 2026 with:
More balanced REO and investor activity
Continued elevation in auction volumes
A stabilization of cancellation rates as lenders refine their strategies
The data strongly suggests that 2025 was not just an incremental change, it was a reacceleration of the local foreclosure cycle.
Recent Articles


Featured Auction
View AllGet The Full Address,
Wellington, Fl 33414
Date: 10/05/2026
Auction Status: Upcoming
Get The Full Address,
West Palm Beach, Fl 33409
Date: 10/05/2026
Auction Status: Upcoming
Get The Full Address,
West Palm Beach, Fl 33412
Date: 10/05/2026
Auction Status: Upcoming
Get The Full Address,
Riviera Beach, Fl 33404
Date: 10/05/2026
Auction Status: Upcoming
Recent Foreclosure Listings
Get The Full Address,
Wellington, Fl 33414
Date: 10/05/2026
Auction Status: Upcoming
Get The Full Address,
West Palm Beach, Fl 33409
Date: 10/05/2026
Auction Status: Upcoming
Get The Full Address,
West Palm Beach, Fl 33412
Date: 10/05/2026
Auction Status: Upcoming
Get The Full Address,
Riviera Beach, Fl 33404
Date: 10/05/2026